
A New Era of Continuous Malaria Intelligence in Nigeria
Nigeria carries the world's largest malaria burden, yet the data guiding the response arrives only once every five years. The Sproxil Nigeria Malaria Survey (SNMS) changes the cadence: continuous, household-level coverage across all 36 states and the FCT, benchmarked against the national surveys.
What is SNMS
The Sproxil Nigeria Malaria Survey (SNMS) is an ongoing, mobile-based survey of household-level malaria indicators across Nigeria. Data collection uses two modes: Computer-Assisted Telephone Interviewing (CATI), administered in English, Hausa, Yoruba, Igbo, and Nigerian Pidgin English to maximise accessibility across the country's diverse linguistic communities, and Computer-Assisted Web Interviewing (CAWI), administered in English. Each survey invitation follows a medicine verification on the Sproxil platform, turning routine authenticity checks into a standing, opt-in reservoir of patients ready to answer future health survey questions.


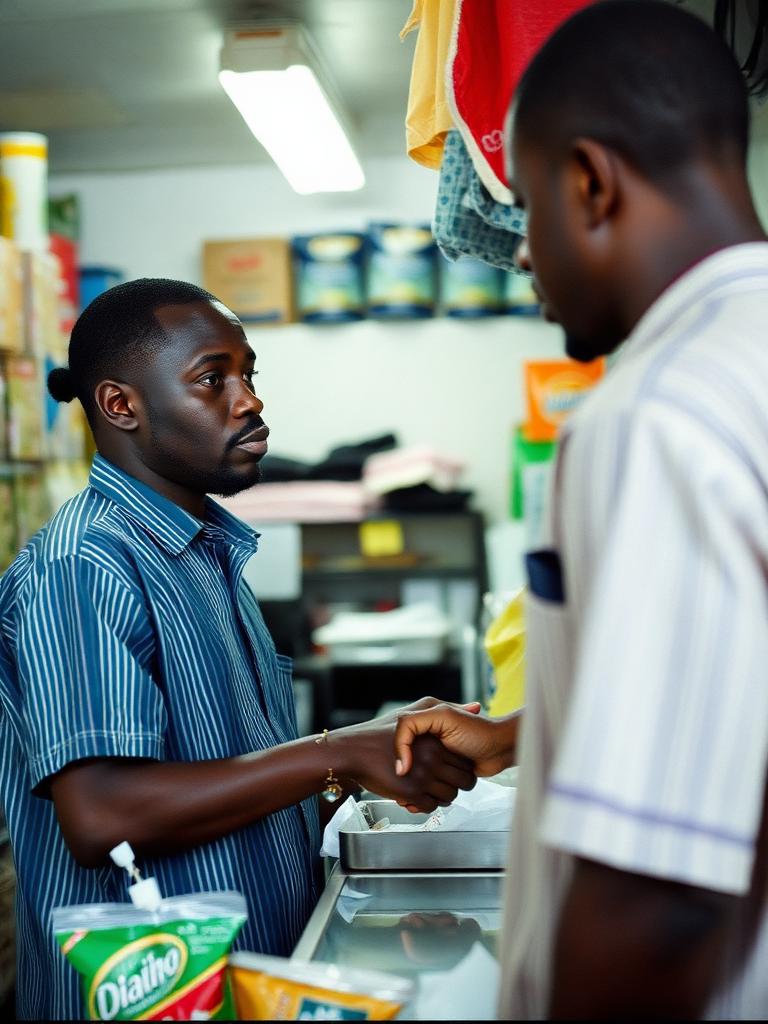
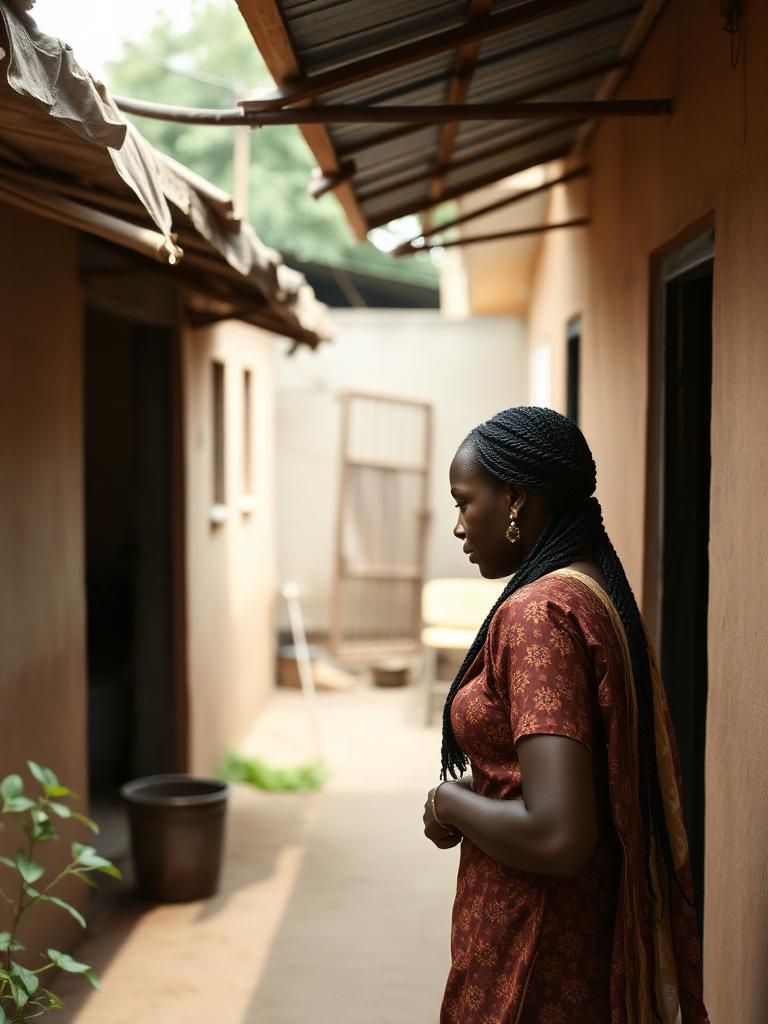

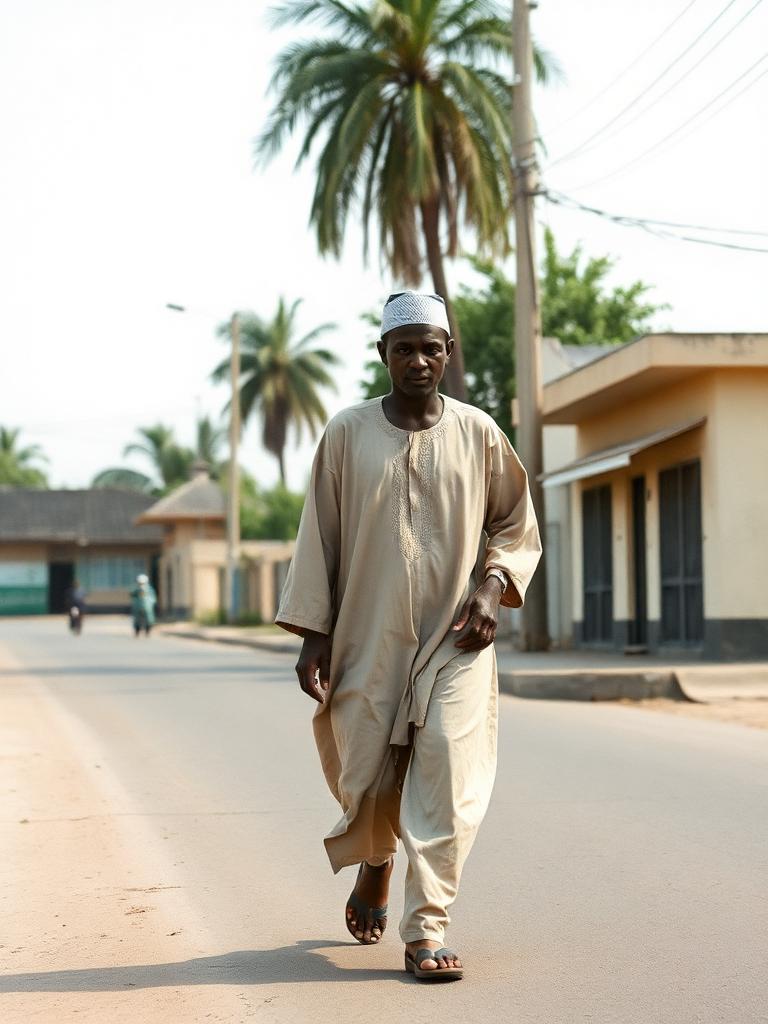

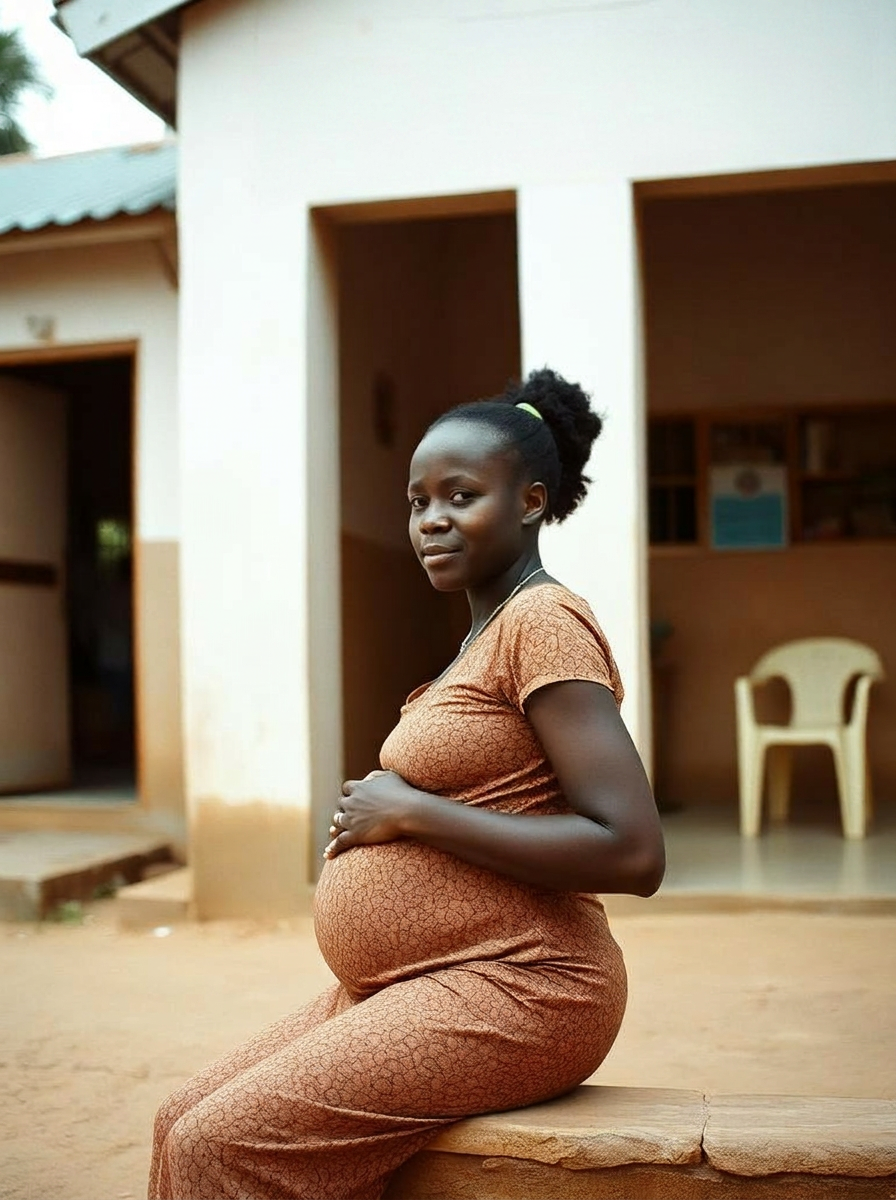

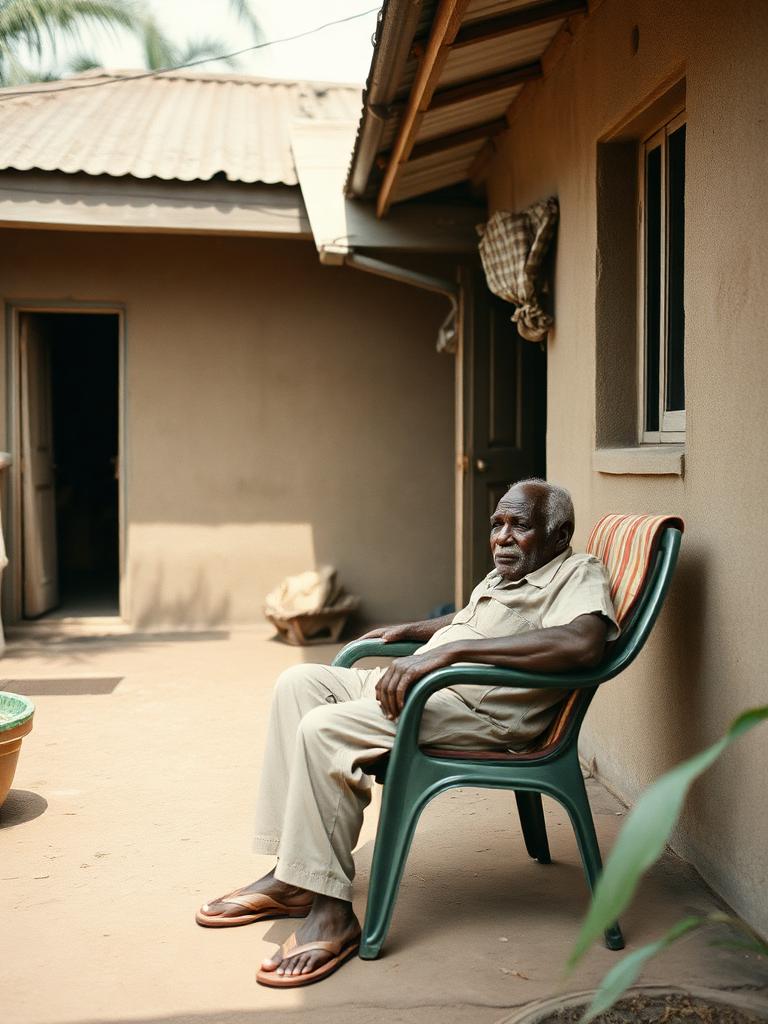
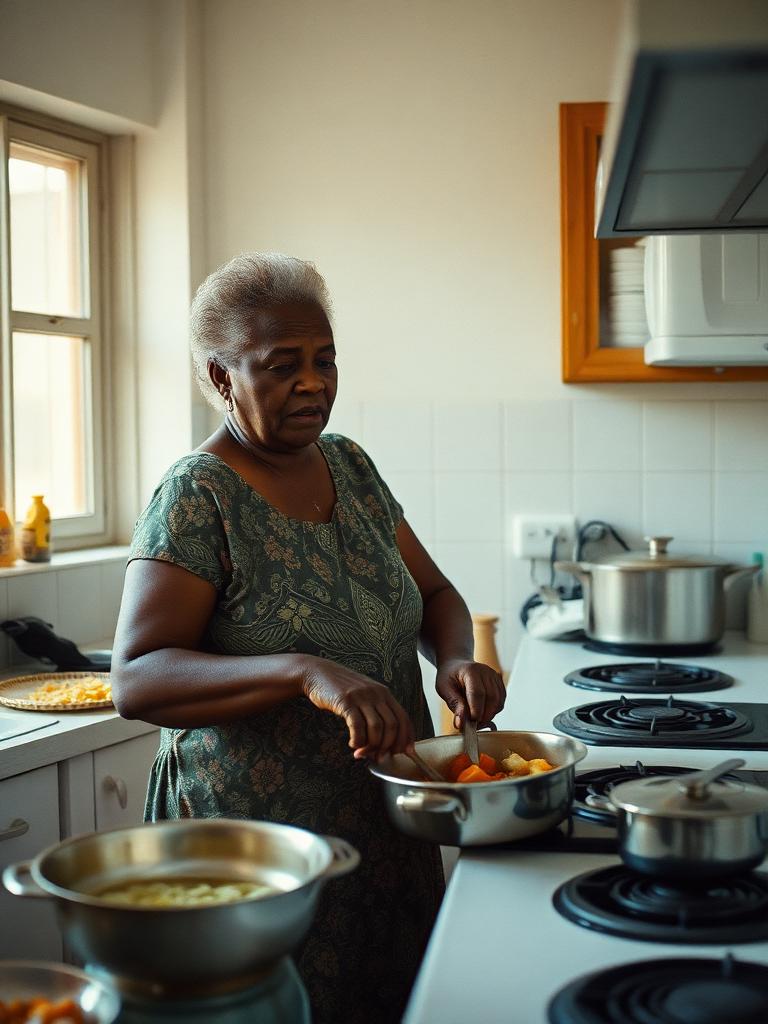

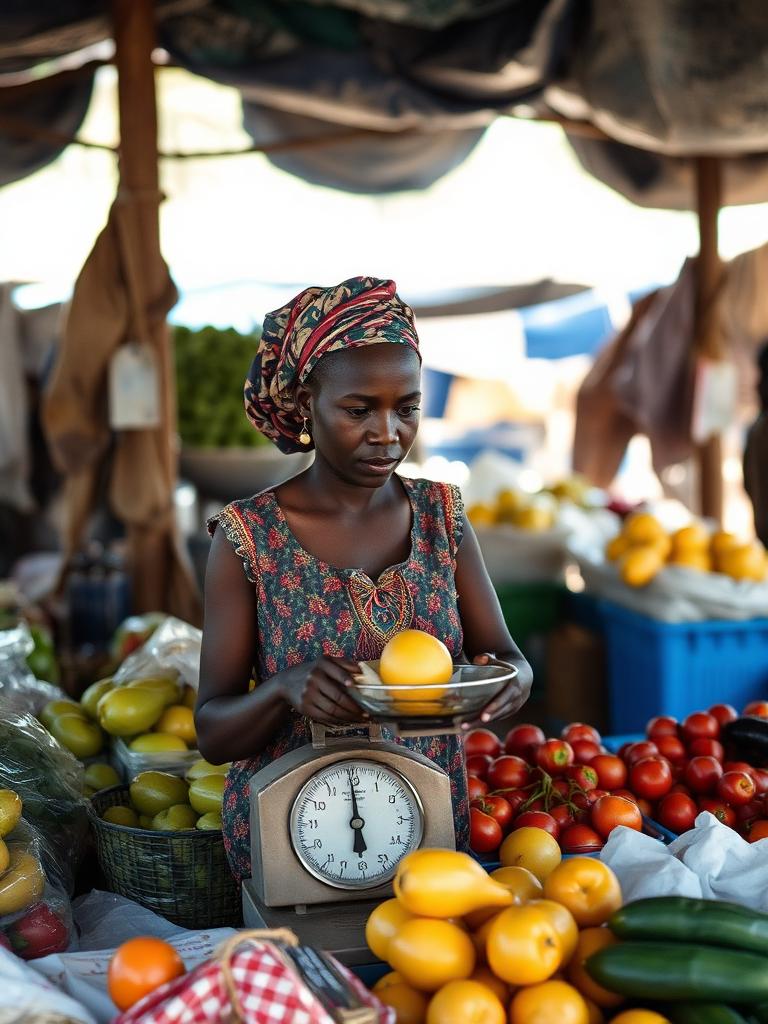

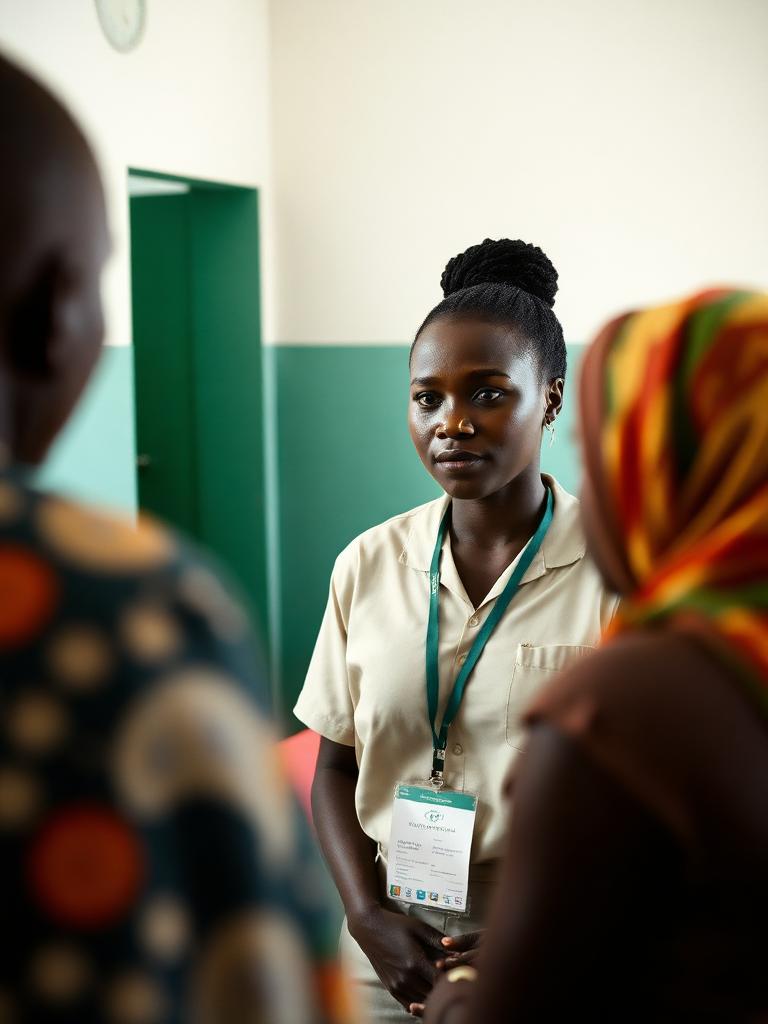
Meet the respondents
Five vignettes representing the most prominent slices of the sample, plus statistical characterization.
National malaria intelligence in motion
Continuous data collection across 36 States + FCT and 758 of 774 LGAs (97.9% national LGA coverage), fielded July 2025 to April 2026.
Visualization shows survey activity at accelerated rate. Actual collection averages around 12 responses per hour across Nigeria.
Why it matters now
Nigeria's malaria surveillance has relied on the Malaria Indicator Survey running every five years. That cadence and that funding model are both under stress. The country needs a continuous, sustainable, sub-national alternative.
Funding gap
Nigeria's MIS funding is uncertain beyond the most recent cycle[4]. PMI activities have been disrupted. FMOH execution rates on malaria-allocated budget historically run below 50 percent. NMEP cannot plan operations on five-year survey snapshots from a survey that may not happen on schedule.
Five years is too slow
ITN distribution campaigns, SMC cycles, the R21 vaccine rollout, and ACT case management all evolve quarterly. A five-year cadence cannot catch shifts in coverage, leakage, or band reclassification when they happen[4][5].
States and bands need their own readings
NMEP's NMSP 2026-2030 stratifies states into four transmission bands[4] with different intervention postures. Each band needs its own coverage signal. National averages mask the operational reality at the LGA and state level.
SNMS is built for the cadence and the resolution that real malaria programming demands. The next section reports what the survey measured.
SNMS Results
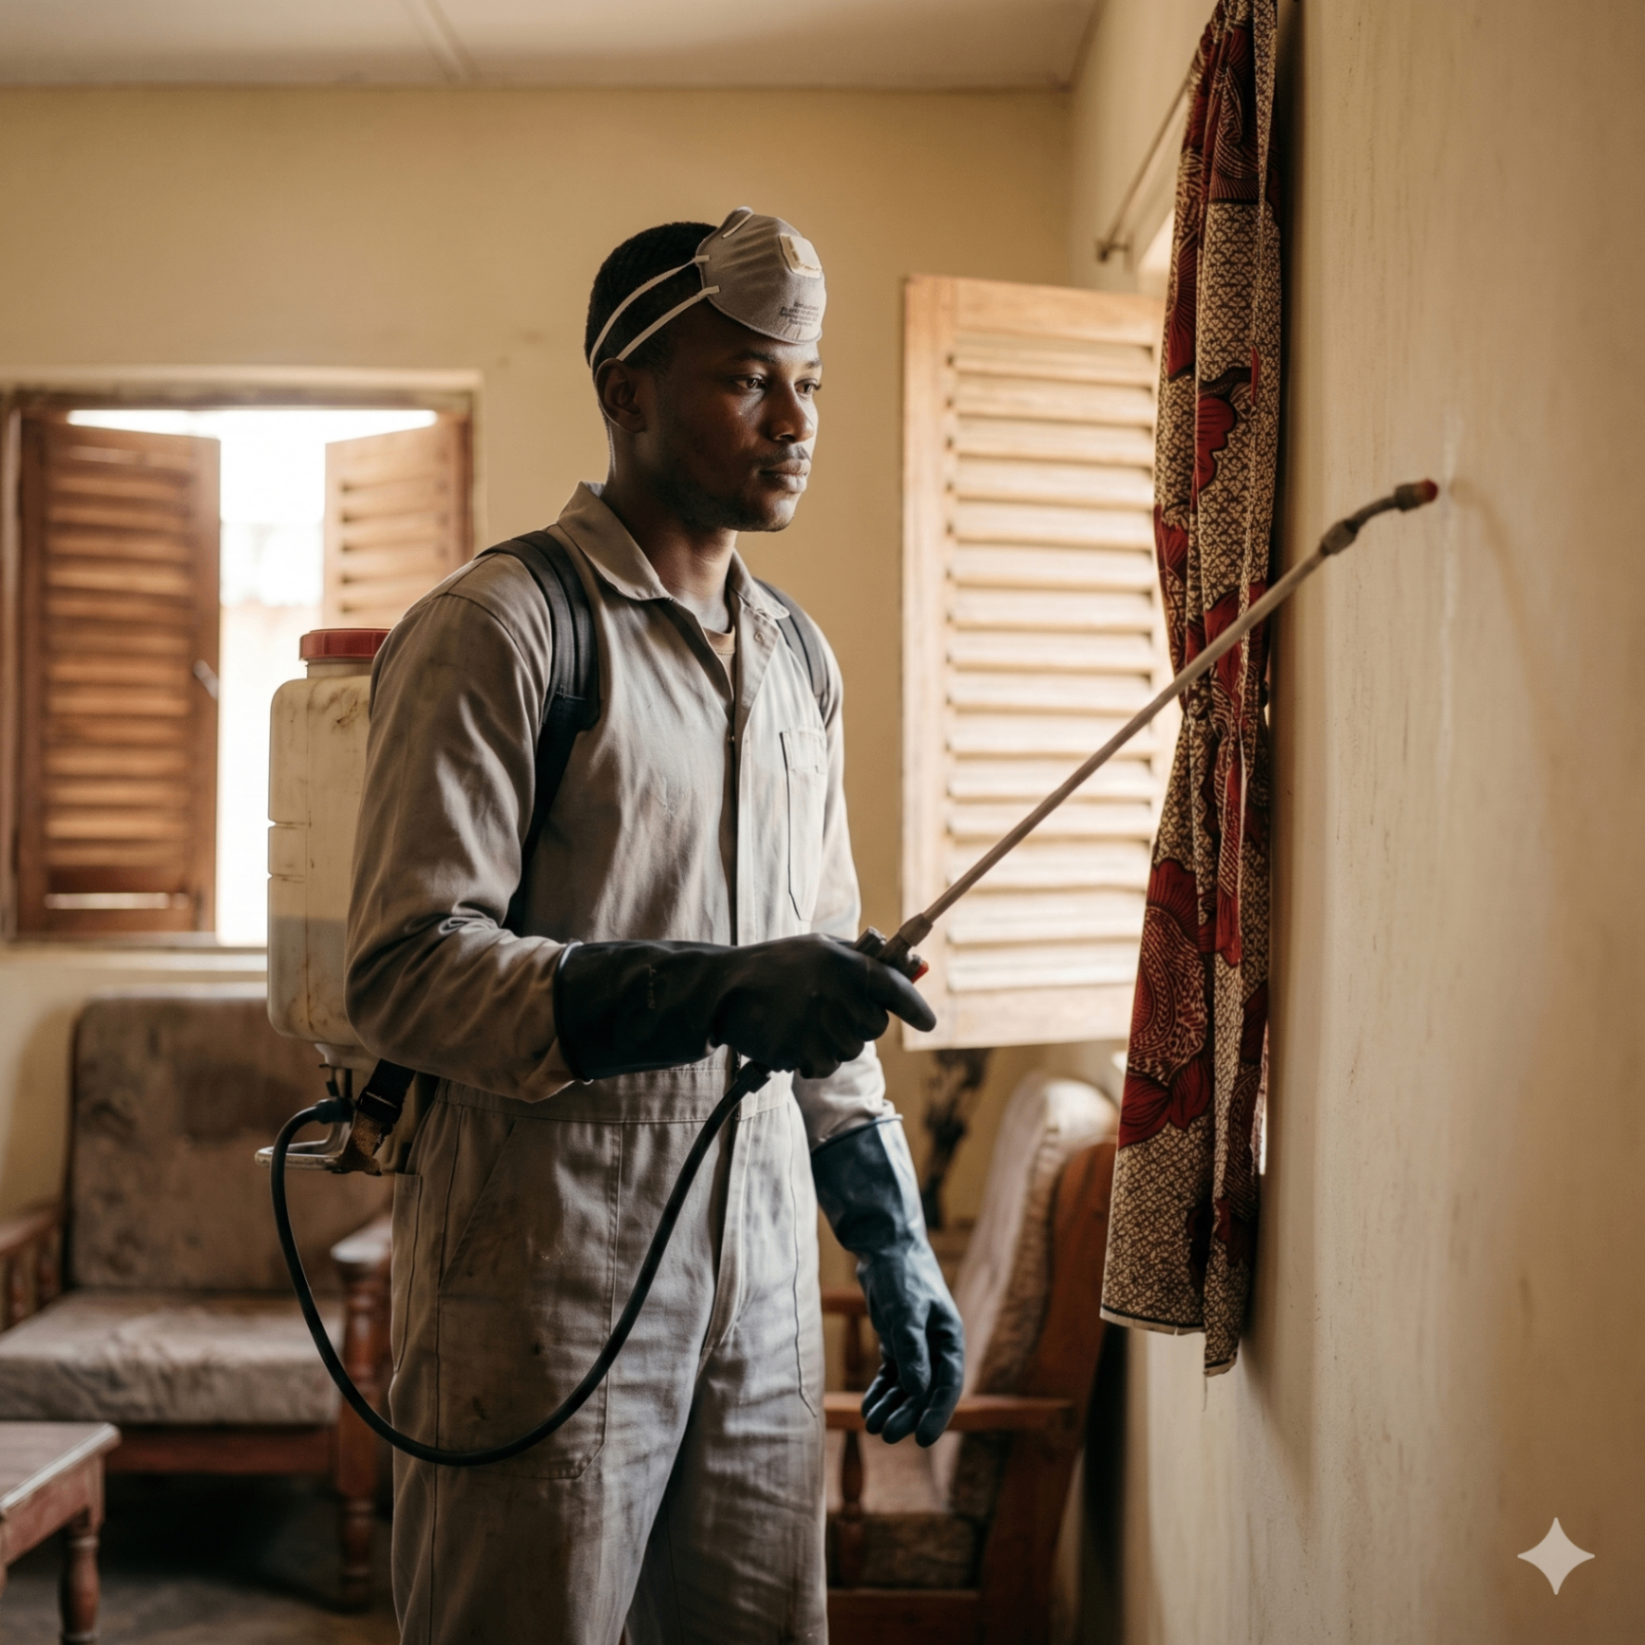
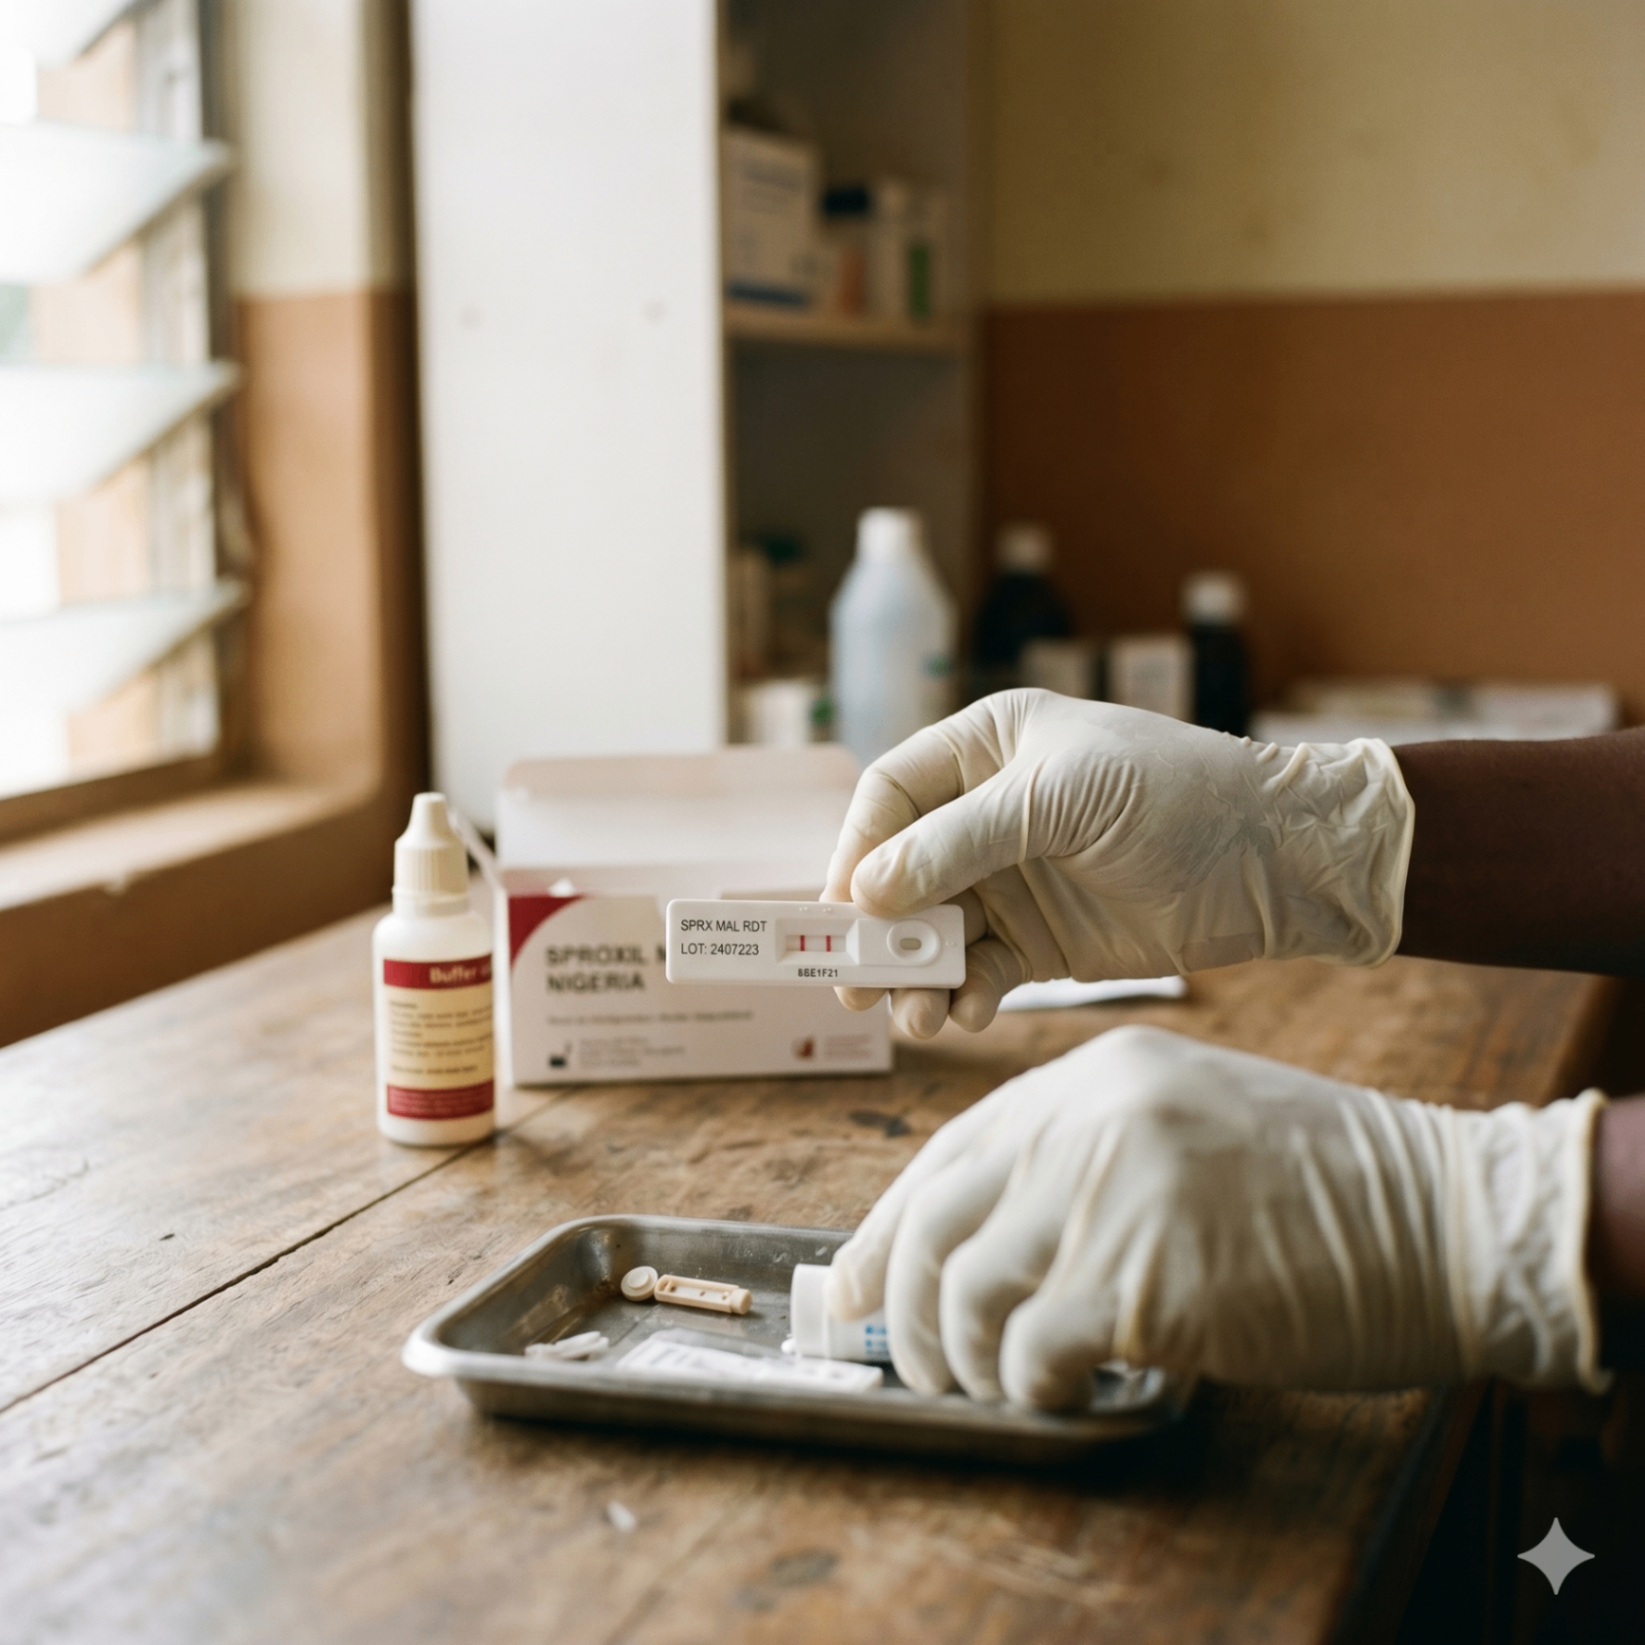
Coverage estimates from the 80,269 respondents in the SNMS analytical dataset, organised by the five NMEP programmatic areas. Each indicator links to its full detail page with construct dimensions, zone by wealth quintile breakdown, and supporting citations.
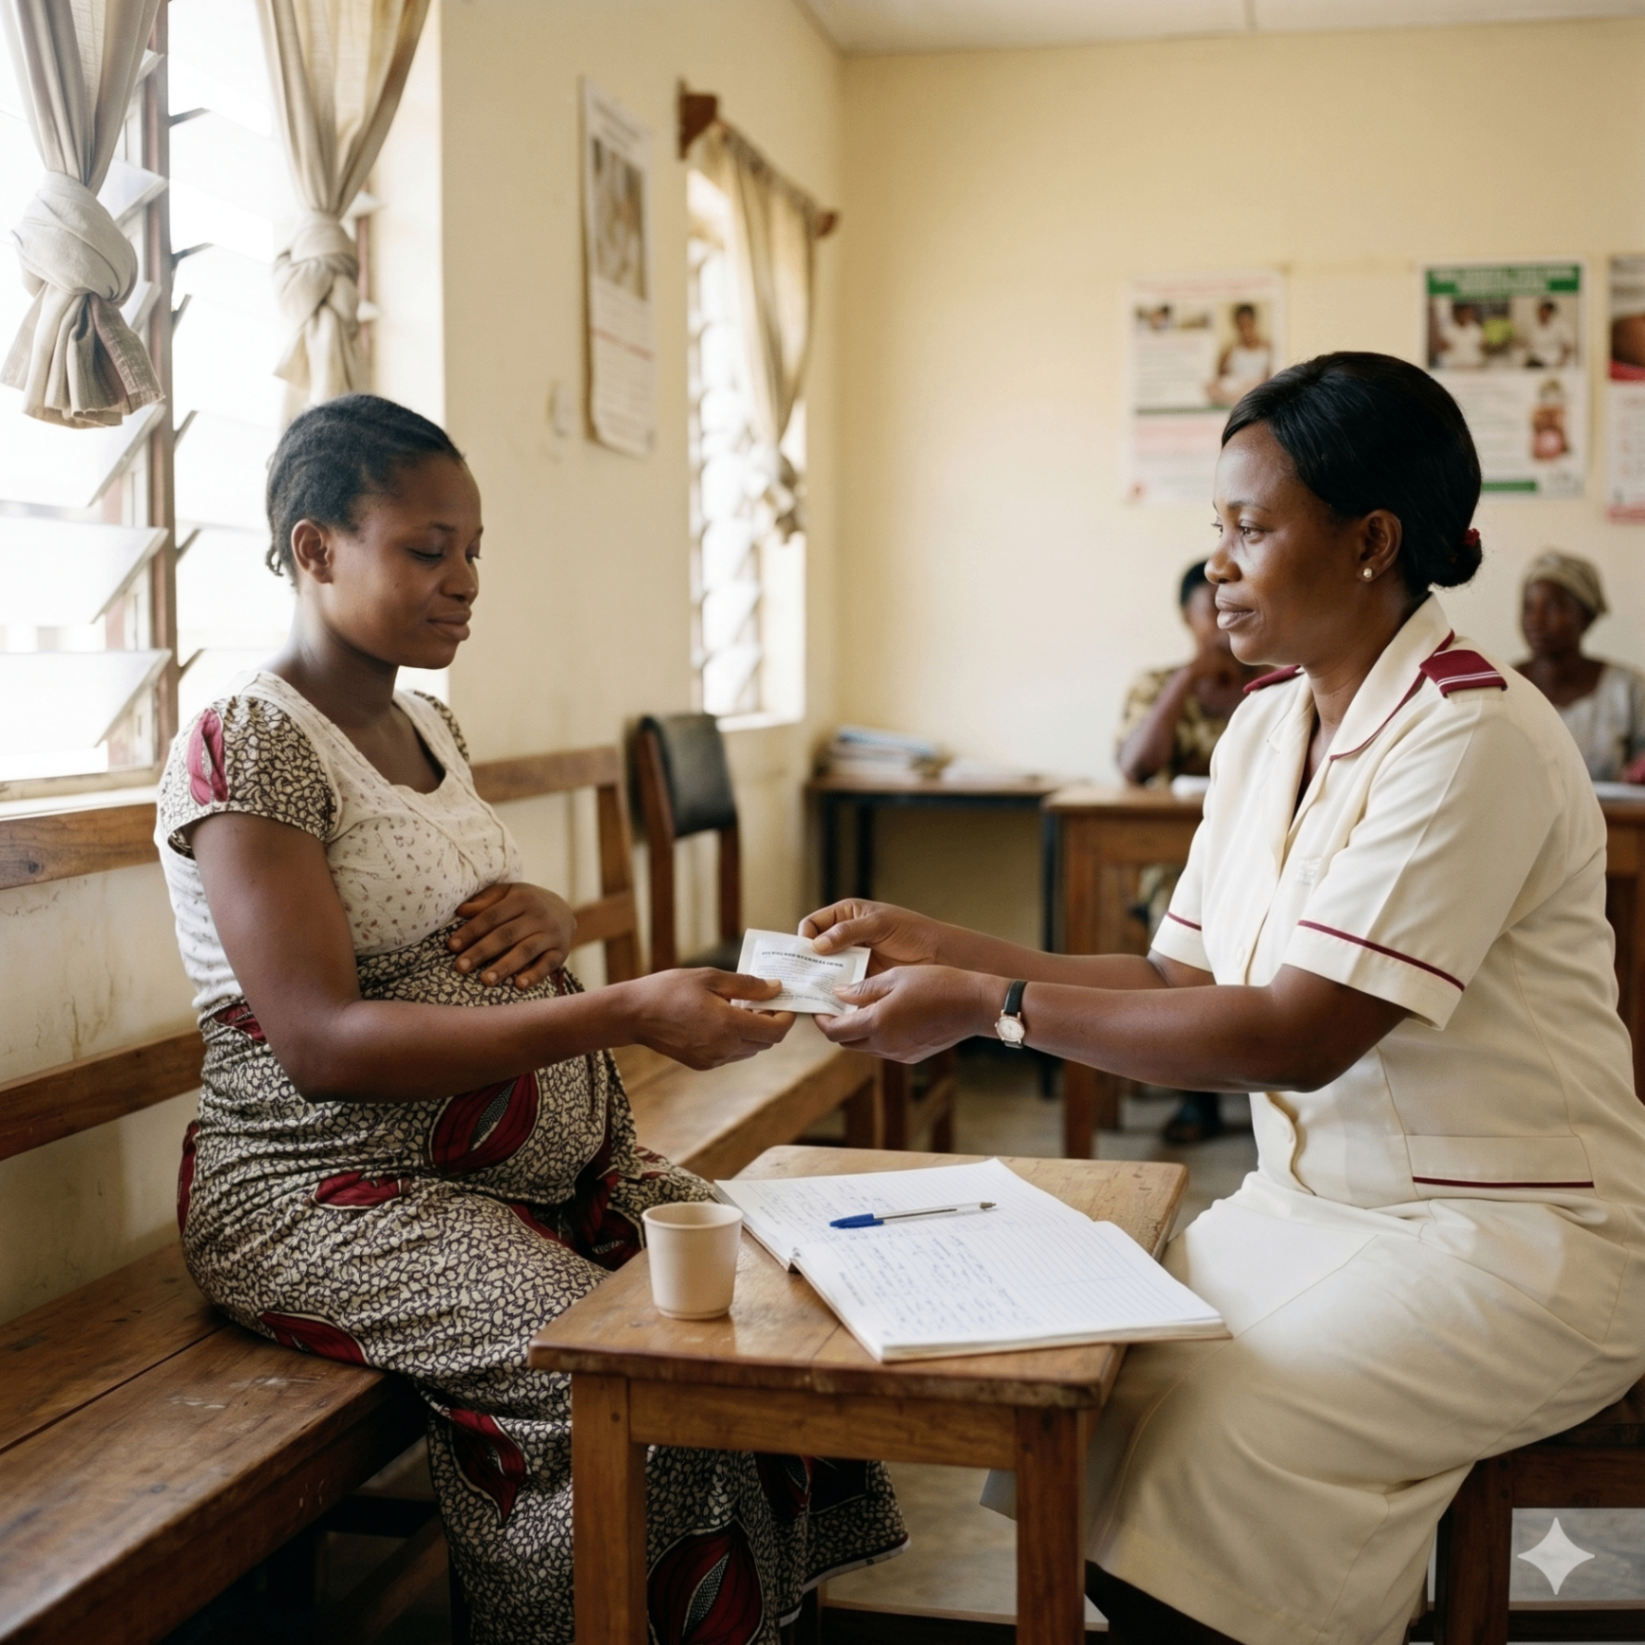
MALARIA IN PREGNANCY
PREVENTION
Headline values are unweighted and describe the engaged population the survey reaches. For comparison with national surveys, the calibrated values and the per-indicator verdicts apply. Click any indicator for definitions, confidence intervals, and zone by wealth quintile breakdown. The full reasoning, including why no wealth reweighting removes the engaged-population selection, is set out in the methodology.
How SNMS compares to MIS 2021 and NDHS 2023-24
Each row shows three SNMS readings (unweighted headline, then the sample raked to each comparator's population margins) paired with the MIS 2021 and NDHS 2023-24 benchmarks and the resulting gaps. The CSIAF framework interprets each gap against construct and empirical thresholds before assigning a substitutability verdict. The summary view follows; click into any indicator for the full breakdown.
| Code | Indicator | SNMS unweighted Headline (engaged population) | Calibrated to MIS 2021 (primary) | Calibrated to NDHS 2023-24 (secondary) | Verdict | ||||
|---|---|---|---|---|---|---|---|---|---|
| SNMS raked to MIS | MIS 2021 | Gap | SNMS raked to DHS | NDHS 2023-24 | Gap | ||||
| I1 | Any net ownership | 66.2% | 57.2% | 57.7% | -0.5 | 53.9% | 59.9% | -6.0 | Substitute with adjustment |
Why this verdict SNMS unweighted (engaged-population headline) is 66.2%. SNMS raked to MIS reports 57.2% against MIS 2021 57.7% (gap -0.5 points); raked to DHS it reports 53.9% against NDHS 2023-24 59.9% (gap -6.0 points). Construct aligned; calibrate for selection. The residual gap after calibration is engaged-population selection that calibration reduces but does not remove, so the calibrated SNMS value is the comparable figure, not the unweighted headline. | |||||||||
| I6 | ANC by skilled provider | 93.3% | 88.7% | 63.0% | +25.7 | 86.4% | 62.5% | +23.9 | Substitute with adjustment |
Why this verdict SNMS unweighted (engaged-population headline) is 93.3%. SNMS raked to MIS reports 88.7% against MIS 2021 63.0% (gap +25.7 points); raked to DHS it reports 86.4% against NDHS 2023-24 62.5% (gap +23.9 points). Numerator aligned to doctor or nurse or midwife; SNMS uses a five-year birth window pending a recency question. The residual gap after calibration is engaged-population selection that calibration reduces but does not remove, so the calibrated SNMS value is the comparable figure, not the unweighted headline. | |||||||||
| ANC4 | ANC 4+ visits | 66.8% | 63.2% | 52.0% | +11.2 | 62.2% | 52.4% | +9.8 | Substitute with adjustment |
Why this verdict SNMS unweighted (engaged-population headline) is 66.8%. SNMS raked to MIS reports 63.2% against MIS 2021 52.0% (gap +11.2 points); raked to DHS it reports 62.2% against NDHS 2023-24 52.4% (gap +9.8 points). Five-year window to harmonise; otherwise aligned. The residual gap after calibration is engaged-population selection that calibration reduces but does not remove, so the calibrated SNMS value is the comparable figure, not the unweighted headline. | |||||||||
| I7b | IPTp 3+ doses | 42.7% | 39.6% | 31.0% | +8.6 | 39.1% | 26.1% | +13.0 | Substitute with adjustment |
Why this verdict SNMS unweighted (engaged-population headline) is 42.7%. SNMS raked to MIS reports 39.6% against MIS 2021 31.0% (gap +8.6 points); raked to DHS it reports 39.1% against NDHS 2023-24 26.1% (gap +13.0 points). Five-year window to harmonise; otherwise aligned. The residual gap after calibration is engaged-population selection that calibration reduces but does not remove, so the calibrated SNMS value is the comparable figure, not the unweighted headline. | |||||||||
| CM-1 | Care-seeking for febrile U5 | 76.9% | 65.6% | 63.0% | +2.6 | 66.1% | 60.0% | +6.1 | Substitute with adjustment |
Why this verdict SNMS unweighted (engaged-population headline) is 76.9%. SNMS raked to MIS reports 65.6% against MIS 2021 63.0% (gap +2.6 points); raked to DHS it reports 66.1% against NDHS 2023-24 60.0% (gap +6.1 points). Child path; construct aligned; calibrate for selection. The residual gap after calibration is engaged-population selection that calibration reduces but does not remove, so the calibrated SNMS value is the comparable figure, not the unweighted headline. | |||||||||
| CM-2 | Diagnostic testing | 61.2% | 54.6% | 24.0% | +30.6 | 54.8% | 20.1% | +34.7 | Substitute with adjustment |
Why this verdict SNMS unweighted (engaged-population headline) is 61.2%. SNMS raked to MIS reports 54.6% against MIS 2021 24.0% (gap +30.6 points); raked to DHS it reports 54.8% against NDHS 2023-24 20.1% (gap +34.7 points). Construct aligned; large level gap is selection, correctable by calibration. The residual gap after calibration is engaged-population selection that calibration reduces but does not remove, so the calibrated SNMS value is the comparable figure, not the unweighted headline. | |||||||||
| CM-3 | ACT receipt | 77.8% | 74.5% | 74.0% | +0.5 | 74.0% | 56.9% | +17.1 | Substitute with adjustment |
Why this verdict SNMS unweighted (engaged-population headline) is 77.8%. SNMS raked to MIS reports 74.5% against MIS 2021 74.0% (gap +0.5 points); raked to DHS it reports 74.0% against NDHS 2023-24 56.9% (gap +17.1 points). Denominator is febrile children who took an antimalarial; aligned. The residual gap after calibration is engaged-population selection that calibration reduces but does not remove, so the calibrated SNMS value is the comparable figure, not the unweighted headline. | |||||||||
| KB-1 | Malaria messages exposure | 63.3% | 54.1% | 46.0% | +8.1 | 50.3% | 37.7% | +12.6 | Substitute with adjustment |
Why this verdict SNMS unweighted (engaged-population headline) is 63.3%. SNMS raked to MIS reports 54.1% against MIS 2021 46.0% (gap +8.1 points); raked to DHS it reports 50.3% against NDHS 2023-24 37.7% (gap +12.6 points). Restricted to women; minor age-ceiling difference. The residual gap after calibration is engaged-population selection that calibration reduces but does not remove, so the calibrated SNMS value is the comparable figure, not the unweighted headline. | |||||||||
| I1b | ITN ownership | 35.5% | 29.1% | 56.0% | -26.9 | 28.5% | 59.2% | -30.7 | Complementary signal |
Why this verdict SNMS unweighted (engaged-population headline) is 35.5%. SNMS raked to MIS reports 29.1% against MIS 2021 56.0% (gap -26.9 points); raked to DHS it reports 28.5% against NDHS 2023-24 59.2% (gap -30.7 points). SNMS uses brand-confirmed LLIN; DHS uses inspection. Different numerator; read as a lower bound. Read the calibrated SNMS value as a complementary signal alongside the national figure, not as a substitute for it. | |||||||||
| I4 | Person ITN use | 32.9% | 25.4% | 36.0% | -10.6 | 24.8% | 36.0% | -11.2 | Complementary signal |
Why this verdict SNMS unweighted (engaged-population headline) is 32.9%. SNMS raked to MIS reports 25.4% against MIS 2021 36.0% (gap -10.6 points); raked to DHS it reports 24.8% against NDHS 2023-24 36.0% (gap -11.2 points). SNMS captures occupancy of one net only; an approximation. Read the calibrated SNMS value as a complementary signal alongside the national figure, not as a substitute for it. | |||||||||
| I4a | U5 ITN use | 57.8% | 51.8% | 41.0% | +10.8 | 53.0% | 42.5% | +10.5 | Complementary signal |
Why this verdict SNMS unweighted (engaged-population headline) is 57.8%. SNMS raked to MIS reports 51.8% against MIS 2021 41.0% (gap +10.8 points); raked to DHS it reports 53.0% against NDHS 2023-24 42.5% (gap +10.5 points). Measured as net use among under-5 households that own a net (a household-occupancy proxy), not per child, and on a different denominator from the DHS measure; read as complementary. Read the calibrated SNMS value as a complementary signal alongside the national figure, not as a substitute for it. | |||||||||
| Pv-1 | SMC coverage | 79.3% | 66.8% | Not measured by national surveys | 63.9% | Not measured by national surveys | New Sproxil measure | ||
Why this verdict SNMS unweighted reports 79.3%; raked to MIS marginals it reports 66.8%, raked to DHS marginals 63.9%. Not measured by national surveys, so no benchmark comparison is possible. No MIS or DHS comparator; SMC scaled after 2021. No MIS or NDHS comparator exists, so SNMS is the only continuous national-level source for this measure. | |||||||||
| Pv-2 | R21 vaccine (any dose) | 67.2% | 53.2% | Not measured by national surveys | 41.0% | Not measured by national surveys | New Sproxil measure | ||
Why this verdict SNMS unweighted reports 67.2%; raked to MIS marginals it reports 53.2%, raked to DHS marginals 41.0%. Not measured by national surveys, so no benchmark comparison is possible. No comparator; R21 introduced after both surveys. No MIS or NDHS comparator exists, so SNMS is the only continuous national-level source for this measure. | |||||||||
| KB-2 | Seasonal-only malaria misconception | 56.2% | 54.8% | Not measured by national surveys | 55.9% | Not measured by national surveys | New Sproxil measure | ||
Why this verdict SNMS unweighted reports 56.2%; raked to MIS marginals it reports 54.8%, raked to DHS marginals 55.9%. Not measured by national surveys, so no benchmark comparison is possible. Share of respondents who believe malaria occurs only during the rainy season. This is incorrect: transmission continues year-round in much of Nigeria. Higher is worse. Sproxil knowledge measure; no national-survey comparator. No MIS or NDHS comparator exists, so SNMS is the only continuous national-level source for this measure. | |||||||||
SNMS unweighted is the engaged-population headline. The two raked values recalibrate the sample to each comparator's population margins and are the figures used for substitutability comparison. Gaps are (calibrated SNMS) minus (benchmark), in percentage points.
Note on I4 versus I4a: under-5 ITN use (I4a, 58.7% unweighted) reads higher than person ITN use (I4, 32.9% unweighted) because the two indicators use different denominators. I4a is measured among under-5 households that own a net and asks whether anyone in the household slept under a net last night; I4 is measured across all respondents, including those who own no net. I4a is a household-occupancy measure, not a per-child measure; a direct per-child net-use question is not in the current instrument. See the I4a indicator page for the full note.
Substitute with adjustment
Any net ownership, ANC by skilled provider, ANC 4+ visits, IPTp 3+ doses, Care-seeking for febrile U5, Diagnostic testing, ACT receipt, Malaria messages exposure
Complementary signals
ITN ownership, Person ITN use, U5 ITN use
New Sproxil measures
SMC coverage, R21 vaccine (any dose), Seasonal-only malaria misconception
Across the 11 comparable indicators, SNMS provides a calibrated substitute for 8 and a complementary signal for 3, and adds 3 measures the national surveys do not carry. SNMS and the national surveys use different designs, a phone non-probability sample versus in-person probability samples, so identical drop-in values were never the goal; substitute with adjustment is the success standard. How these are assessed is explained in the methodology.
Verdicts are assigned via the CSIAF Cross-Survey Indicator Alignment Framework and read from the canonical indicator module, so the counts above always match the per-indicator verdicts in the framework methodology table. Mode effects in self-reported malaria indicators[6] and mode differences between face-to-face and web surveys[11] motivate the mode-of-administration ratings; spatial modelling of healthcare utilisation for fever treatment[7] and decomposition of socioeconomic inequalities in malaria morbidity[8] inform the zone by wealth quintile breakdown.
What SNMS Delivers That MIS and DHS Cannot
Across the 11 comparable indicators, SNMS provides a calibrated substitute for 8 and a complementary signal for 3, and adds 3 measures the national surveys do not carry. The four capabilities below are part of that additive contribution: independent measures the standard MIS and DHS instruments do not produce. How these are assessed is explained in the methodology.
SMC coverage by state and band
SMC is not in the MIS 2021 questionnaire. SNMS provides the first survey-based coverage estimate for the 20 SMC states and the Federal Capital Territory, with 79.3 percent of eligible under-5 children reporting receipt. NMEP can compare this to SMC campaign administrative records and DHIS2 dose counts for triangulation.
Drill inR21 vaccine reach (Bayelsa and Kebbi)
The R21 vaccine rollout reached 67.2 percent of age-eligible children in the two Phase-1 states. MIS did not measure this (Phase-1 began in December 2024, after MIS fieldwork). SNMS provides the first independent measure complementing NPHCDA Phase-1 administrative reports.
Drill inBrand-confirmation cascade and PPMV channel intelligence
SNMS captures self-reported net brand and asks where nets were obtained - a field assessment of net brand recall[9]. This produces brand-level coverage rates the MIS net-inspection methodology cannot, plus a view of the patent-and-proprietary-medicine-vendor channel, validated against community drug-vendor surveys[10], that the public-clinic-focused MIS does not see. Useful for ITN procurement planning and PPMV regulatory engagement.
Drill inSeasonal-only malaria misconception
DHS does not capture behavioural beliefs about malaria. SNMS finds that 56.2 percent of respondents believe malaria occurs only during the rainy season. This is a misconception: transmission continues year-round in much of Nigeria, so higher is worse. The belief correlates with weaker net use and delayed care-seeking outside the rainy months, providing leading-indicator value for behaviour-change messaging.
Drill inPPMV channel detail
Nineteen percent of ITNs in SNMS were acquired through PPMVs - informal medicine vendors that operate in nearly every Nigerian community but are poorly captured by clinic-centred surveys. This channel matters operationally and for ITN regulatory and counterfeit-prevention strategy.
CSIAF: Cross-Survey Indicator Alignment Framework
Across the 11 comparable indicators, SNMS provides a calibrated substitute for 8 and a complementary signal for 3, and adds 3 measures the national surveys do not carry. CSIAF evaluates each SNMS indicator against MIS 2021[4] and NDHS 2023-24[5] across six construct dimensions and four empirical dimensions, with verdicts assigned via explicit conjunction rules. The framework draws on Groves and Lyberg's total-survey-error framework[1], Meng's defect-correlation framework for non-probability samples[2], and the Madans, Loeb & Altman cross-survey alignment methodology[3]. How these are assessed is explained in the methodology.
Six construct dimensions
- U
Universe
Each dimension is rated A Aligned, P Partial, or M Misaligned.
- N
Numerator
Each dimension is rated A Aligned, P Partial, or M Misaligned.
- D
Denominator
Each dimension is rated A Aligned, P Partial, or M Misaligned.
- R
Reference period
Each dimension is rated A Aligned, P Partial, or M Misaligned.
- Md
Mode
Each dimension is rated A Aligned, P Partial, or M Misaligned.
- V
Verification
Each dimension is rated A Aligned, P Partial, or M Misaligned.
Verdict types
Substitute with adjustment
SNMS reading substitutes after a named, transparent correction (question routing, denominator).
Complementary signal
Tracks the same construct but in a constrained universe; useful alongside the reference.
New Sproxil measure
Measures something MIS and DHS do not - a new operational signal.
Verdict distribution across the 14 SNMS indicators
See the full per-indicator ratings in the CSIAF documentCounts are read from the canonical indicator module so they always match the verdicts shown in the comparison table above. The hosted CSIAF document at /docs/csiaf-methodology is the single source of truth for the per-indicator construct, numerator, denominator, reference-period, mode, and verification ratings.
I1, I6, ANC4, I7b, CM-1, CM-2, CM-3, KB-1
I1b, I4, I4a
Pv-1, Pv-2, KB-2
NMEP State Transmission Bands
The National Malaria Strategic Plan 2026-2030 stratifies Nigeria's 36 States + FCT into four transmission bands[4]. Each band has its own intervention posture: which interventions are to be Delivered, Implemented, or Monitored. Band membership (Mod-A: 14 states, Mod-B: 13, Low-A: 8, Low-B: 2) reflects the 2025 MIS state prevalence assignments[13]. SNMS provides band-level readings against that posture.
Loading Nigeria geometry…
A FIRST FOR NIGERIA
Zero states in the High transmission band
For the first time since malaria surveillance began at the state level in Nigeria, no state reports 35 percent or higher prevalence among children aged 6 to 59 months. The 2025 MIS shows that 75 percent of states experienced a reduction from the prior cycle, and the national prevalence fell to 15.2 percent, down 7 percentage points[13]. This is the structural milestone that legitimises the shift from emergency control to systematic elimination planning under the NMSP 2026 to 2030.
Source: 2025 NMIS Executive Summary[13] (FMOH-NMEP-NPC, April 2026)
| Indicator | Mod-A | Mod-B | Low-A | Low-B |
|---|---|---|---|---|
| ITN mass campaign I1 | DELIVER 71% −9pp | DELIVER 67% −13pp | IMPLEMENT 58% −22pp | MONITOR 49% −31pp |
| ITN continuous distribution I1 | IMPLEMENT 71% −9pp | DELIVER 67% −13pp | DELIVER 58% −22pp | IMPLEMENT 49% −31pp |
| IPTp 3+ delivery I7b | DELIVER 38% −22pp | DELIVER 44% −16pp | IMPLEMENT 47% −13pp | MONITOR 42% −18pp |
| ANC skilled provider I6 | DELIVER 89% −6pp | DELIVER 94% −1pp | IMPLEMENT 96% on posture | IMPLEMENT 97% on posture |
| Diagnostic testing CM2 | DELIVER 60% −20pp | DELIVER 63% −17pp | DELIVER 65% −15pp | IMPLEMENT 59% −21pp |
| ACT treatment CM3 | DELIVER 78% −7pp | DELIVER 77% −8pp | DELIVER 76% −9pp | IMPLEMENT 75% −10pp |
| SMC coverage Pv1 | DELIVER 52% −18pp | IMPLEMENT 47% −23pp | - - - | - - - |
| R21 vaccine Pv2 | DELIVER see list - | DELIVER see list - | - - - | - - - |
R21 vaccine: the universe is two Phase-1 rollout states only, Kebbi (Mod-A) and Bayelsa (Mod-B). The two band cells marked "see list" point to the per-state band list below; per-band value split is not published in this view.
Per-state band list
Canonical mapping of every named state to its NMSP 2026-2030 transmission band. Used as the source of truth for the band scorecard, the R21 universe, and any state vignette on this site.
- Adamawa
- Akwa Ibom
- Bauchi
- Ebonyi
- Imo
- Kaduna
- Kano
- Katsina
- Kebbi
- Niger
- Sokoto
- Taraba
- Yobe
- Zamfara
- Abia
- Bayelsa
- Benue
- Cross River
- Edo
- Ekiti
- Gombe
- Jigawa
- Kwara
- Nasarawa
- Ondo
- Osun
- Oyo
- Anambra
- Borno
- Delta
- Enugu
- Federal Capital Territory
- Kogi
- Ogun
- Rivers
- Lagos
- Plateau
The four-band intervention posture is taken from the NMSP 2026-2030. SNMS band-weighted readings use unweighted SNMS values aggregated by respondent count across states in the band. Click any indicator name to see the full indicator detail with confidence intervals and methodology.
How SNMS Becomes Even Stronger
Eight technical and methodological improvements would strengthen SNMS further. None require renegotiating the survey's core design. All are incremental and can be deployed in stages with NMEP partnership.

Higher fieldwork frequency
Move from annual to quarterly fieldwork in selected states. Quarterly cadence catches SMC cycle dynamics, ITN distribution campaigns, and R21 rollout progress at policy-relevant resolution. SNMS infrastructure supports this without redesign.
Adding biomarker capability
A targeted RDT validation subsample on a household-visit follow-up could anchor SNMS self-report rates to laboratory-confirmed parasitaemia. This addresses the V (verification) gap that currently rates Partial across most indicators.
Expanding instrument depth
Add PPMV mystery-shopping modules, a full ANC provider roster (matching DHS m2a-m2n variables), and per-net roster questions to close the I1b ITN-ownership construct gap. Each addition is roughly 90 seconds of interview time.
Instrument co-design with NMEP
Co-designing the next SNMS wave's instrument with NMEP would align question wording to MIS variables, improve cross-survey comparability, and embed NMEP's operational questions directly. This becomes a precondition for SNMS standing in for MIS in 2026-2030.
IPW calibration framework as standing capability
Inverse probability weighting against the MIS-anchored wealth, zone, education, and urban/rural marginals brings substitutable indicators into tolerance. Build this as a standing pipeline so each SNMS wave produces IPW-adjusted estimates by default.
DHIS2 admin records integration
Triangulate SNMS findings with DHIS2 routine service-delivery data (SMC dose counts, ANC visit counts, ACT issuance) for cross-validation. This addresses cases where neither MIS nor NDHS has a comparator (Pv-1, Pv-2).
Sub-LGA resolution
Where SNMS density allows, report selected indicators at Local Government Area level. The current SNMS sample exceeds 1,000 respondents in 7 LGAs, enough for LGA-level confidence intervals on high-prevalence indicators. NMEP microplanning would directly benefit.
Subpopulation oversampling
Stratified oversampling in high-burden zones for pregnant women, caregivers of febrile children, and rural respondents would shrink the n-too-small gap that currently leaves 92 of 420 cells suppressed in the zone by wealth quintile matrix.
These improvements are not prerequisites for using SNMS today. They are upgrade paths. Across the 11 comparable indicators, SNMS provides a calibrated substitute for 8 and a complementary signal for 3, and adds 3 measures the national surveys do not carry (Pv1 SMC, Pv2 R21, KB2 seasonal-only misconception). SNMS and the national surveys use different designs, a phone non-probability sample versus in-person probability samples, so identical drop-in values were never the goal; substitute with adjustment is the success standard. How these are assessed is explained in the methodology. Mode differences between face-to-face and web surveys[11] and documented quality gaps in care provided to pregnant women in private vs public facilities in Nigeria[12] remain active areas for methodological calibration.
Put SNMS data to work in your programme
Request full access to indicator detail pages, state-level breakdowns, and the zone-by-wealth heatmap. Our team can also arrange a bespoke briefing for your malaria programme.